Analytics, dashboards and client reports
Read your production, finance and social numbers in Analytics, save dashboards for your team, email clients a scheduled report and check the activity log.
7 min readUpdated November 7, 2026
Video lesson: Advanced Analytics
Overview
Analytics is one view with three kinds of numbers: how production is moving (what is late, how long each stage takes, who delivered what), what the work earns and costs, and how your clients' posts perform on social media. Admins and supervisors use it to run the agency. Editors get a smaller version that shows only their own work and pay.
Around it sit three tools: saved dashboards, so each person or the whole team can keep the cards they care about in one layout; scheduled client reports, which email a client a branded recap on their own; and the activity log, which records who did what and when.
Open Analytics
- Go to your workspace home and click Analytics (the bar-chart icon) in the view switcher above the task list.
- Analytics opens on Global View, covering every brand you can see. Pick a brand or project in the left panel to narrow it.
- Use the section chips at the top to jump between All, Production, Finance and Social analytics.
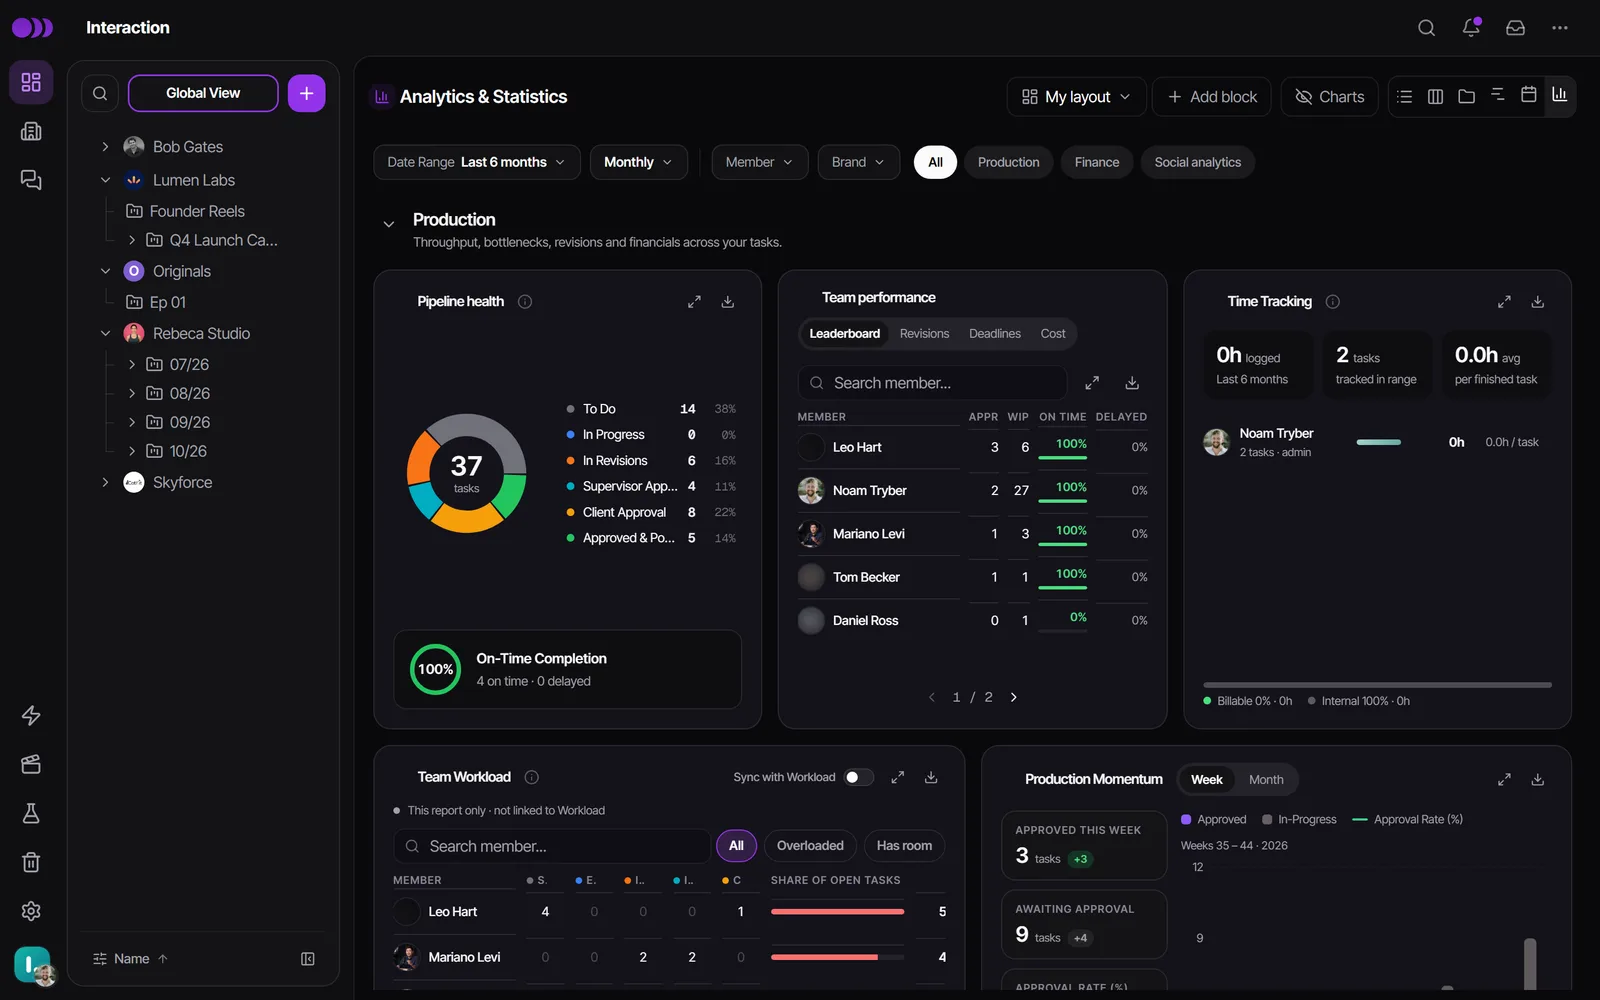
Admins always see Analytics. Supervisors see it only after an admin switches on Analytics View in Settings -> Team & permissions -> Permissions (it reads Admins only until then). Editors always see it, limited to the tasks they are assigned to.
What each section shows
Production answers "is the work moving?":
- Pipeline health: tasks by stage, plus how many are on time and how many are delayed.
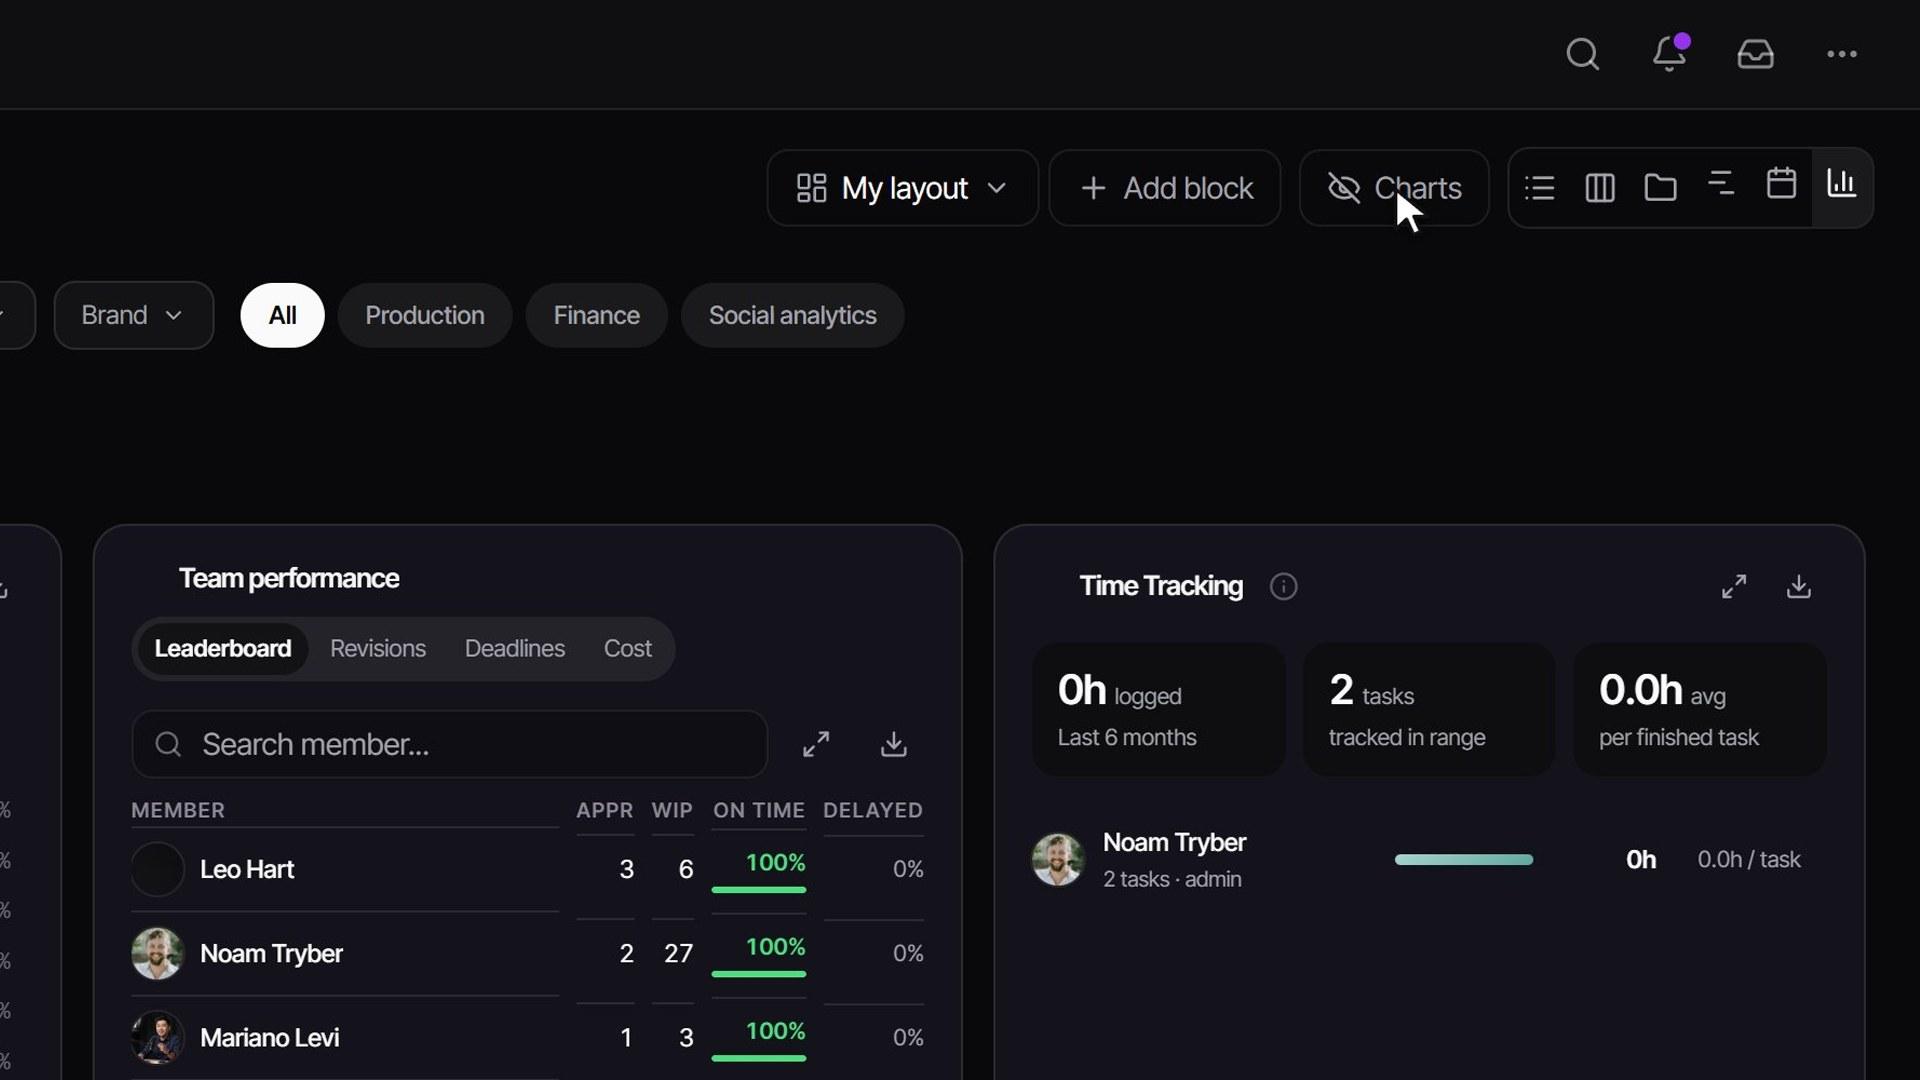
- Team performance: a Leaderboard, Revisions, Deadlines and, for managers, Cost (what each person costs against the revenue their work brought in).
- Editor deliveries: per editor, per week, how many new deliveries and revisions they sent, and what is waiting on the client right now.
- Stage duration & revisions: how many days work spends in each stage and where it slows down.
- Time Tracking, Team Workload, Production Momentum, Capacity & media and Time Utilization.
Finance (managers only) shows what you Billed, what you Collected, your Team cost and your Profit, plus Team cost vs paid, Invoiced vs collected and Project profitability. How those numbers are built is explained step by step in Finance, pricing and editor pay.
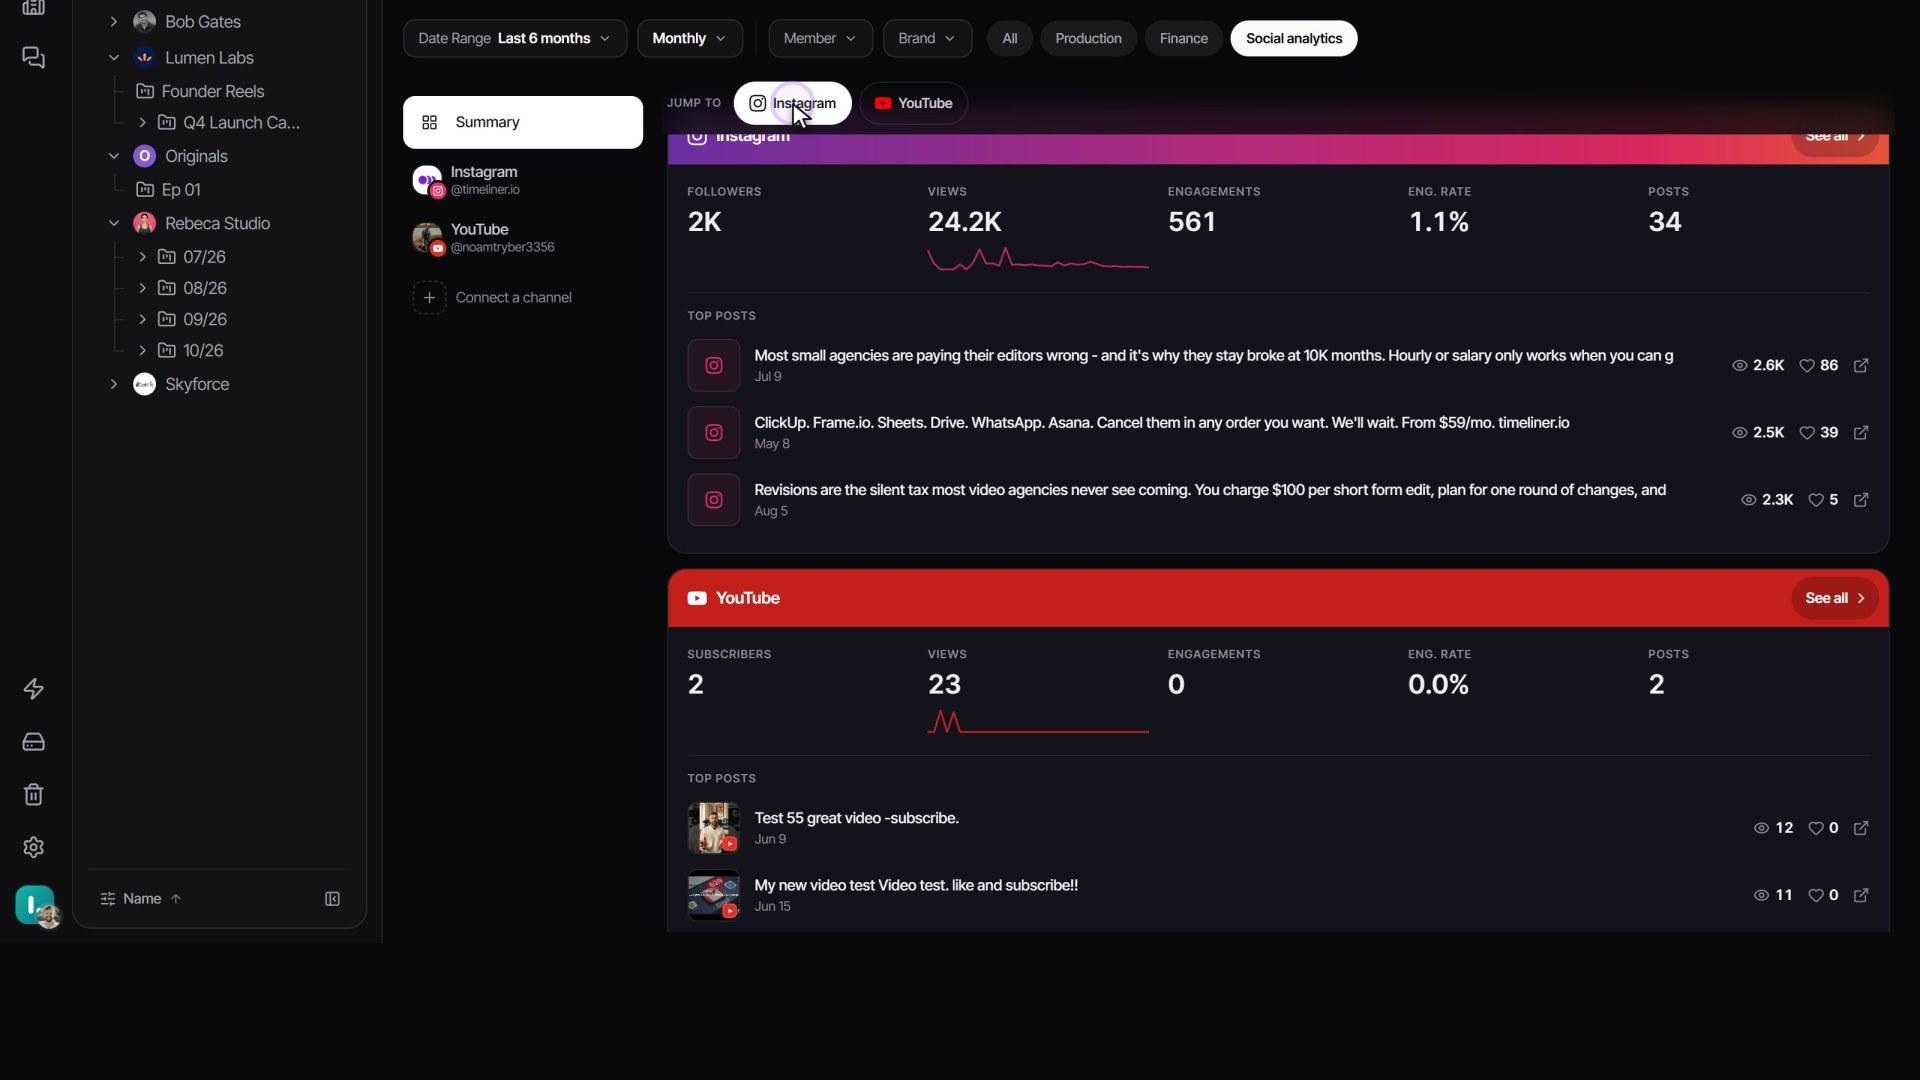
Social analytics covers posts on the brands' connected accounts: Views, Engagement, Engagement rate, Audience growth and Posts published, each compared with the period before. The Summary page puts every network on one scroll with a Jump to row, and See all opens a network's own page. The What worked card lists your Top performers and Underperformers with the patterns behind them.
Admins see every brand's social numbers. Supervisors and editors see only the brands they are members of. If a brand is missing for someone, add them to that brand.
Filter, arrange and export
- Date Range starts on Last 6 months. Switch between Monthly and Weekly, and narrow by Member or Brand. Clear filters resets them.
- Dates follow when the task was created (a project price follows the project's start date). If a number looks wrong, check the range first.
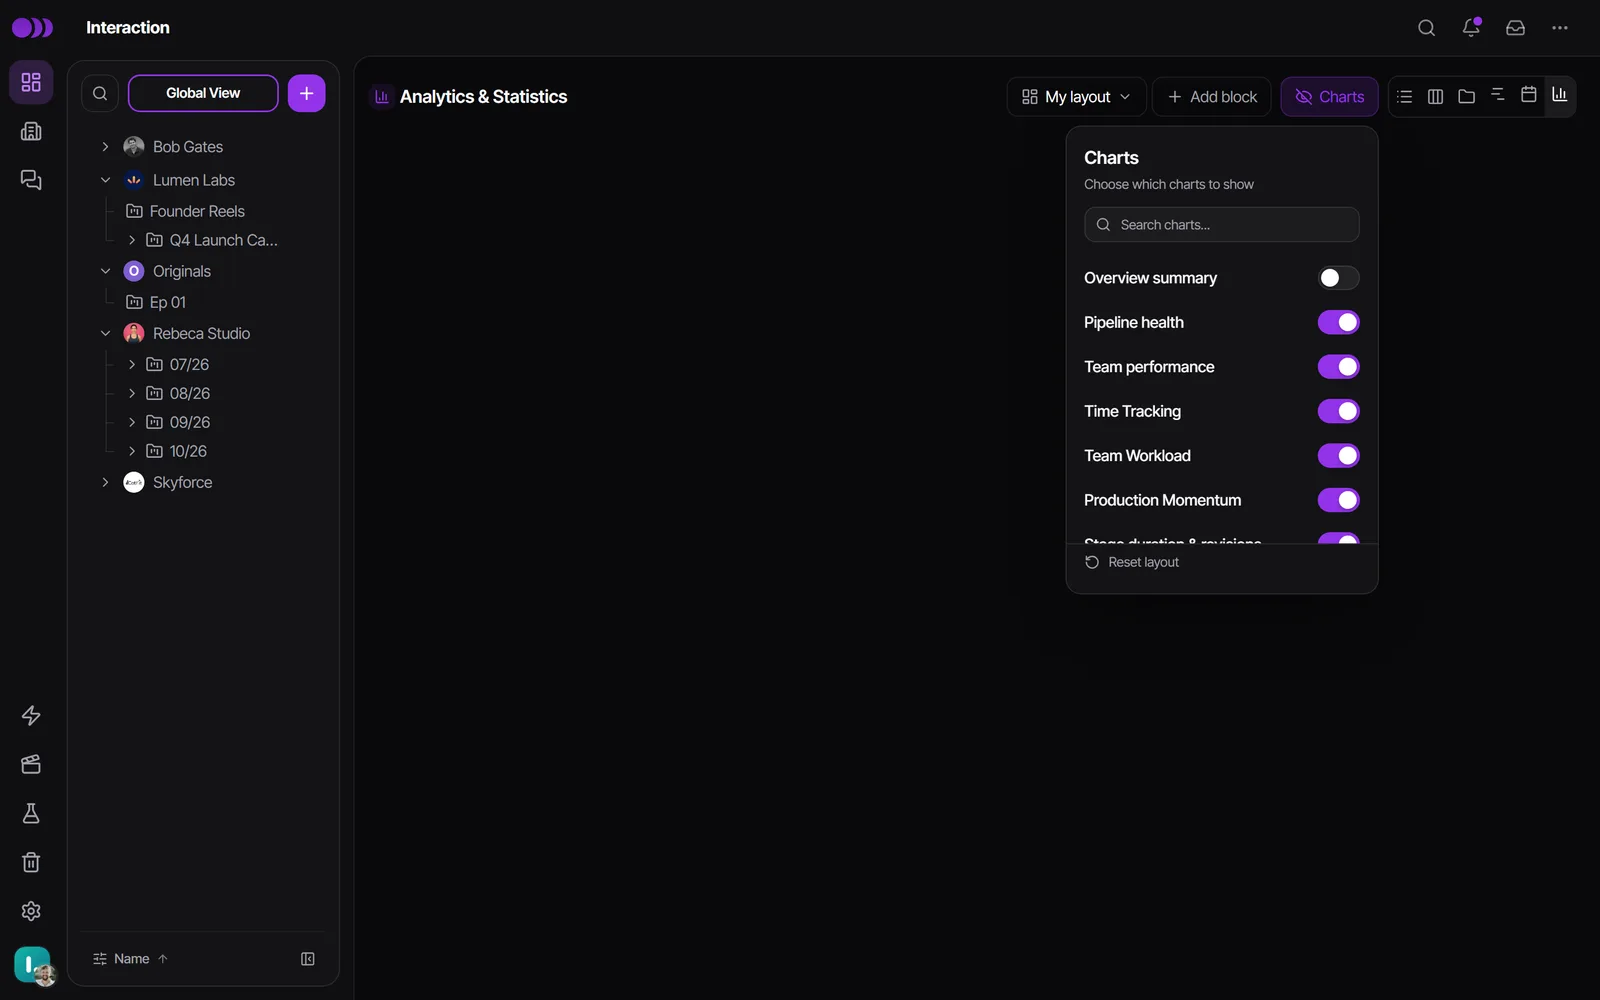
- Charts in the header lets you search for a card, show or hide cards and turn on the Overview summary strip (Total Tasks, On-Time Rate, Active Team, Billed, Profit). Reset layout puts everything back.
- On a computer, drag a card by its header and resize it from the corner.
- Each card's expand button opens a detail view. Export it as CSV, PNG or Branded PDF. Branded PDFs carry your agency's logo and name.
Save a dashboard for yourself or your team
A saved dashboard remembers which cards are shown, where they sit, their sizes and any notes you added. Use one for a monthly client review, a finance check-in or a Monday production meeting.
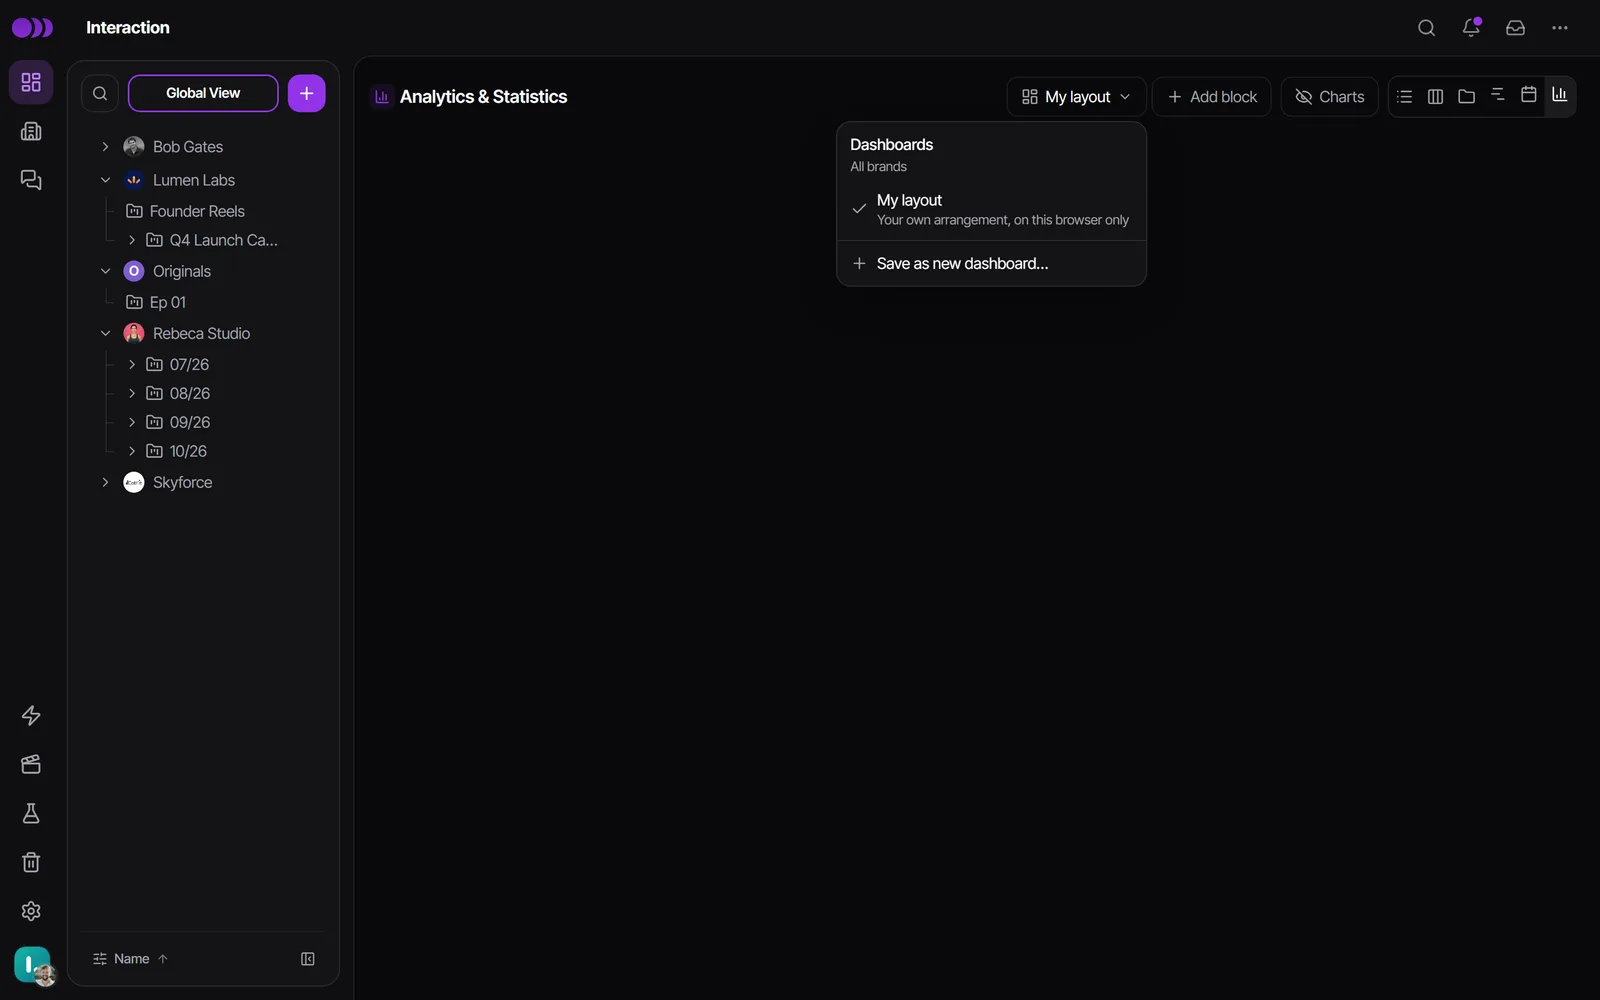
- Arrange the cards the way you want them. The picker to the left of Charts reads My layout, which is your own arrangement, kept in this browser only.
- Open the picker and click Save as new dashboard….
- Give it a name. Under Who can open it, choose Only me or The team, then click Save dashboard.
- To add a title or a note between the cards, click Add block (the + next to the picker) and choose Heading or Text. The pencil edits a block and the bin removes it.
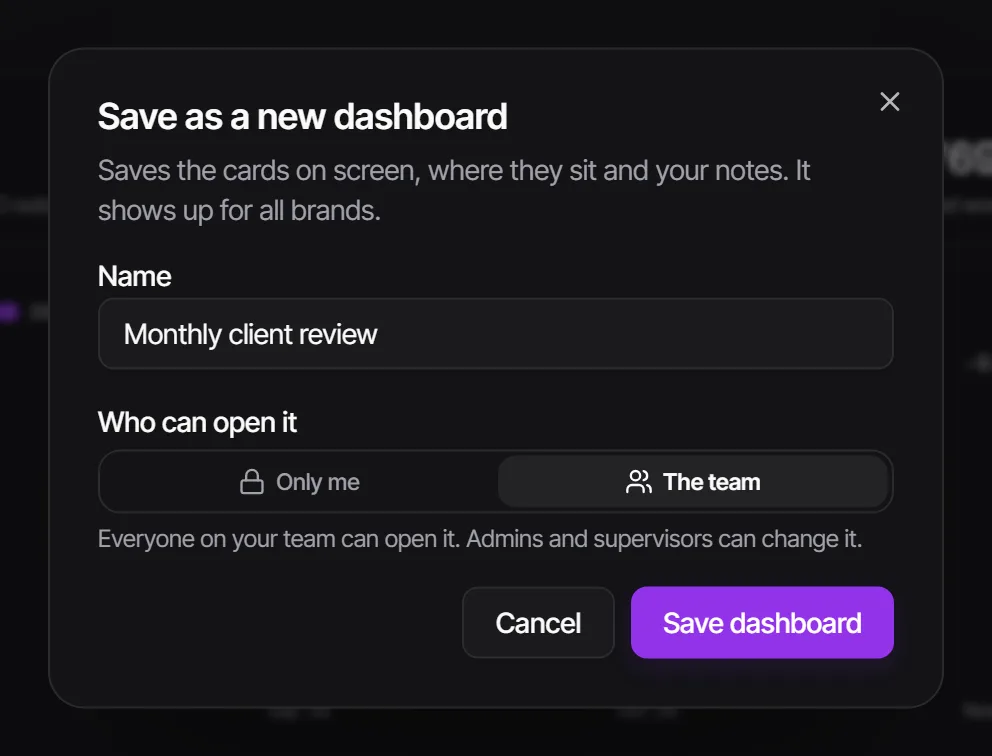
- A dashboard saved while a brand is selected belongs to that brand and shows up only when you look at that brand. One saved in Global View shows up for all brands.
- A team dashboard opens with the same layout for everyone. Admins and supervisors can change it, and their changes save on their own. Editors see it as View only and can use Save a copy to make their own.
- The dashboard's … menu holds Rename, Save a copy, Share with the team or Make private, and Delete.
- Each workspace can have up to 20 team dashboards, and each person up to 20 private ones. Notes and dashboards are for your team only; clients never see them.
Email your client a scheduled report
Instead of writing "here's where we are" emails by hand, let Timeliner send each client a branded recap on a schedule. The client does not need an account.
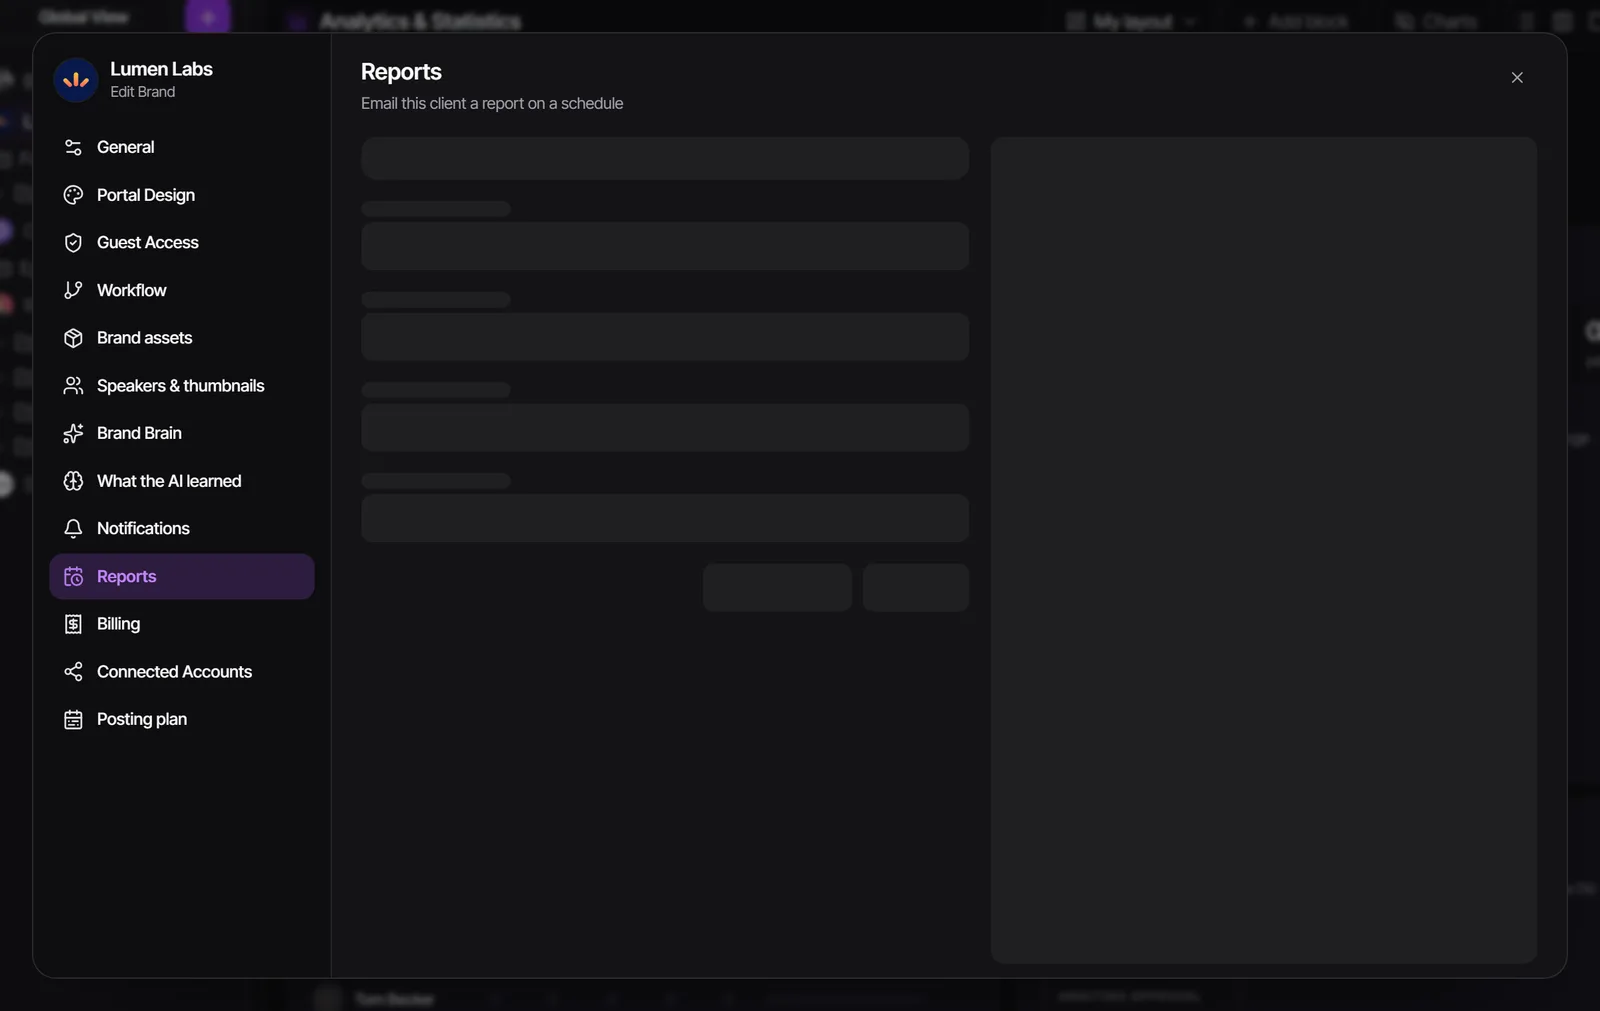
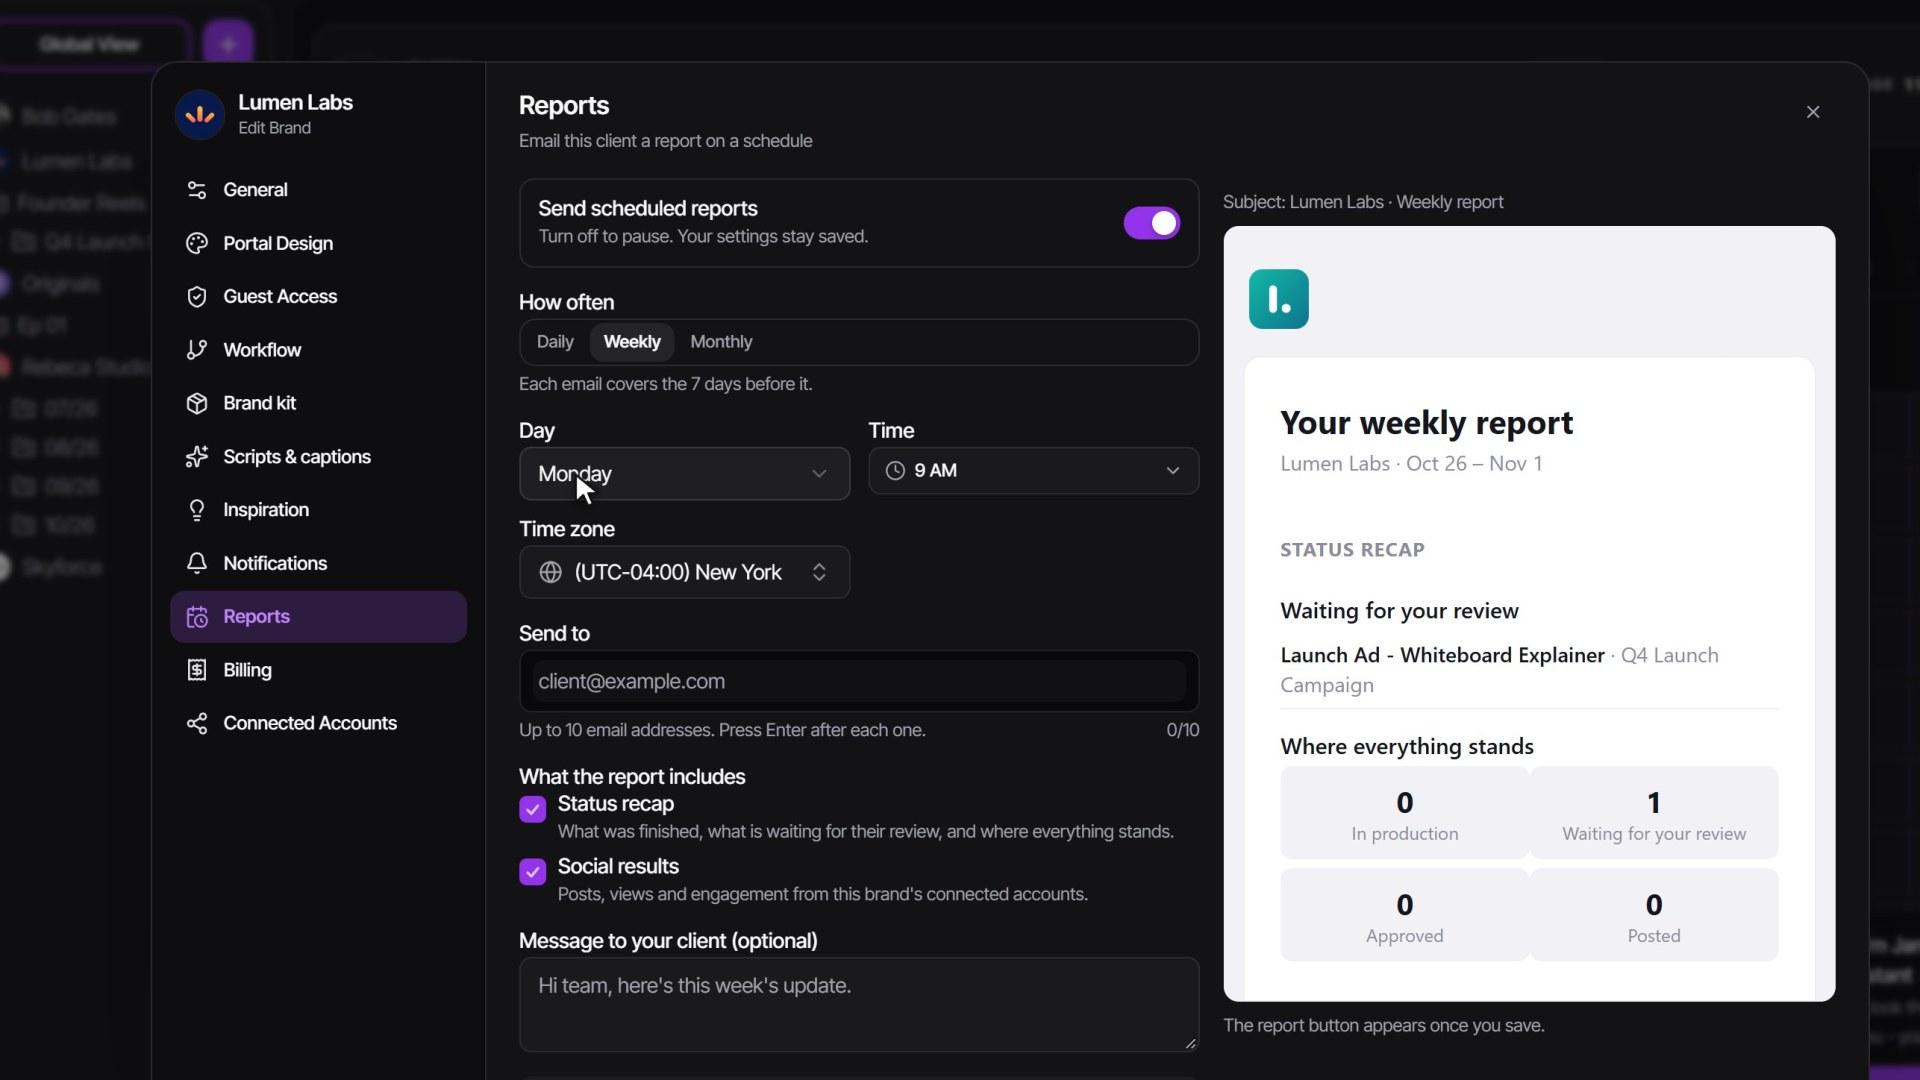
- In the left panel, open the brand's three-dot Actions menu and click Edit Brand, then open the Reports tab. (Or, in Analytics with one brand selected, go to Social analytics -> Export -> Schedule report....)
- Turn on Send scheduled reports and pick Daily, Weekly or Monthly, the time and the time zone. The form tells you what period each email covers.
- Under Send to, add up to 10 client email addresses.
- On the Design tab, choose up to six Headline numbers (on plans with posting these include Posts, Views and Engagements) and the Sections, such as Waiting for their review and Top posts (chart). Set the look and add an optional message.
- Click Send test to get a copy yourself, then Save.
Weekly and monthly reports always go out. A daily report is skipped on a day with nothing new. A client can unsubscribe from the link in the email; only they are removed. Switch Send scheduled reports off to pause without losing your settings.
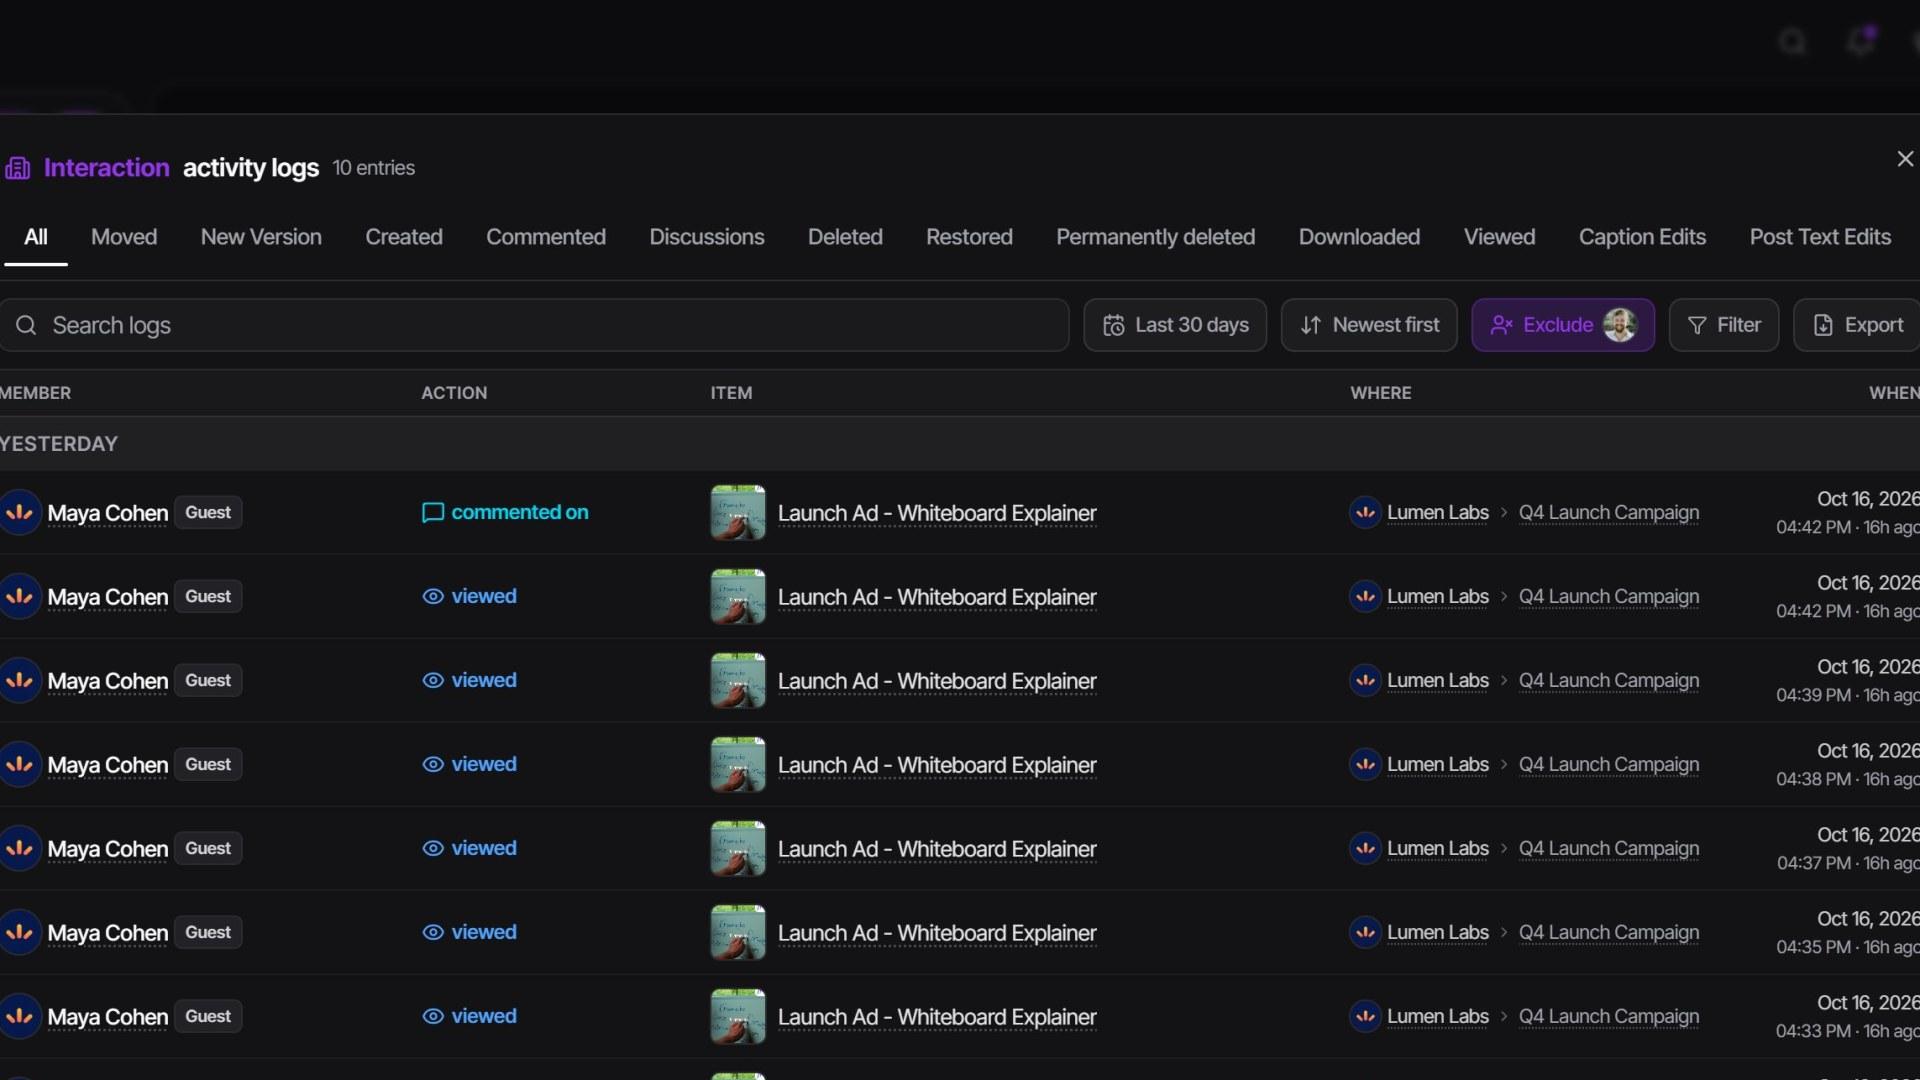
See who did what in the activity log
- Click the Activity Log icon (a clock on a page) in the top bar. A brand, folder or project header opens a log for just that place.
- Pick a tab such as Moved, New Version, Deleted or Downloaded, or stay on All.
- Narrow it with the filters, the search box and the time range.
- To keep a record or send it to a client, click Export and choose Download PDF or Download CSV.
The log records status moves, new versions, comments, downloads, views, deletions and restores, setting changes and post schedule changes, each with the person and the time.
Who can do this, and on which plan
| What | Who | Plan |
|---|---|---|
| Full Analytics, including Finance and Team performance | Admins; supervisors once an admin allows it | Agency and Scale |
| Pipeline health, Time Tracking, Capacity & media | Admins, supervisors with access, editors (own work) | Studio and up |
| Social analytics | Team members, per brand they belong to | Plans with social posting (Studio for its one brand) |
| Team dashboards | Admins and supervisors create and change them; everyone on the team opens them | Same as Analytics |
| Scheduled client reports | Admins and supervisors | Agency and Scale |
| Activity log | Admins and supervisors | Agency and Scale (the All time range on Scale) |
On a plan without a card, it stays visible but blurred behind an Upgrade card, so you can see what it does. Compare plans on the pricing page.
Watch it
Questions people ask
Can my supervisors see Analytics?
Yes, once an admin switches on Analytics View in Settings -> Team & permissions -> Permissions. They then see everything, including brand finances.
Can my editors see how much clients pay?
No. Editors see only the tasks they are assigned to and their own pay. Client prices, revenue and margin are never shown to them.
Can my client see analytics?
Not the team dashboard. You can add Analytics to your Client views, which gives clients a portal dashboard with their deliverables and, on plans with posting, their post results. Your saved dashboards and notes stay internal.
Why don't my numbers match Instagram's app?
Timeliner re-reads each post's numbers on a schedule, often during the first two days and less often after that. A lower number usually means the next read hasn't happened yet. Use the refresh button next to Metrics updated for the latest.
Can I send a weekly report to my client automatically?
Yes. Open the brand's Edit Brand -> Reports tab, pick Weekly, add their emails and save. Agency and Scale plans.
Still stuck?
Ask Janet, the assistant inside Timeliner, email our team, or ask the community on Discord. We answer every message.